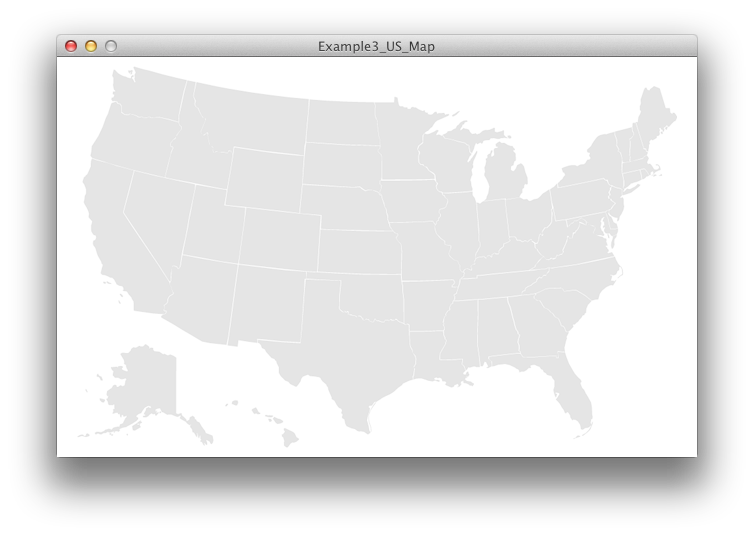

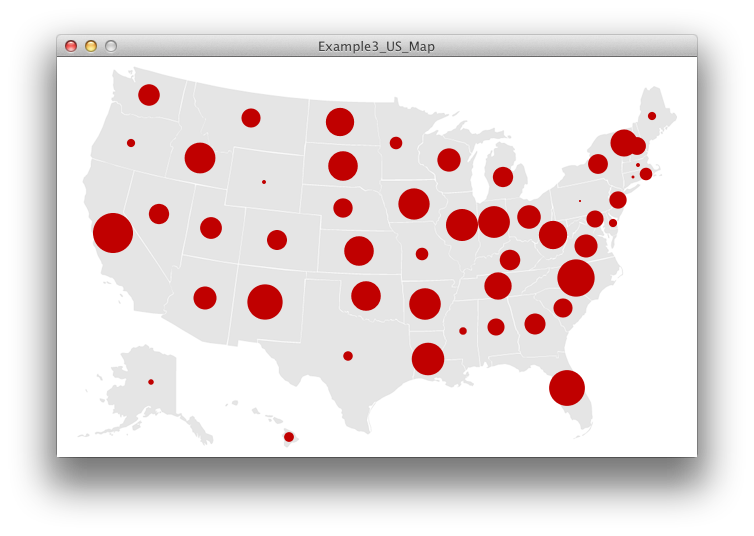
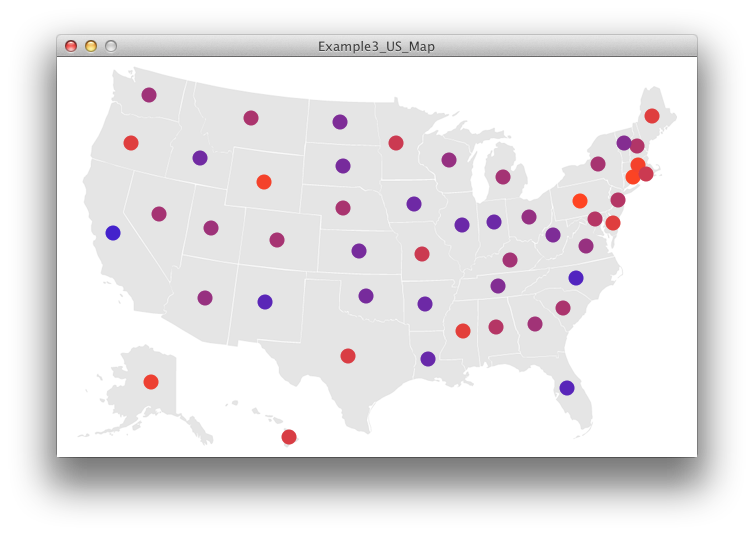
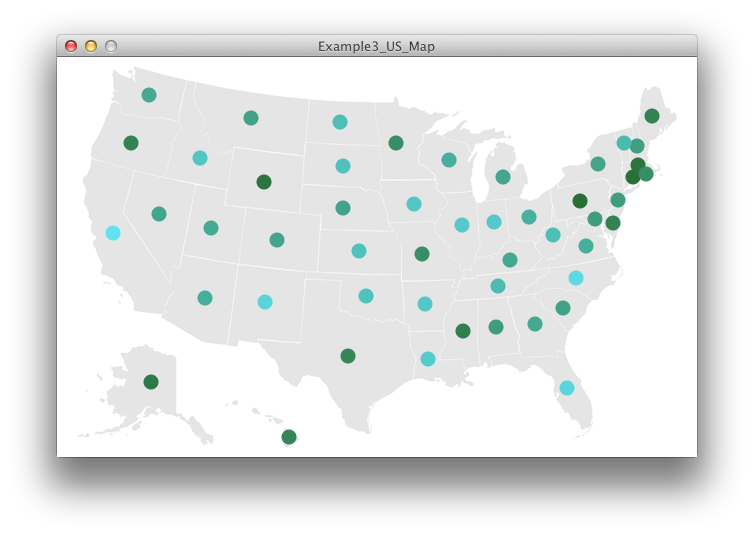
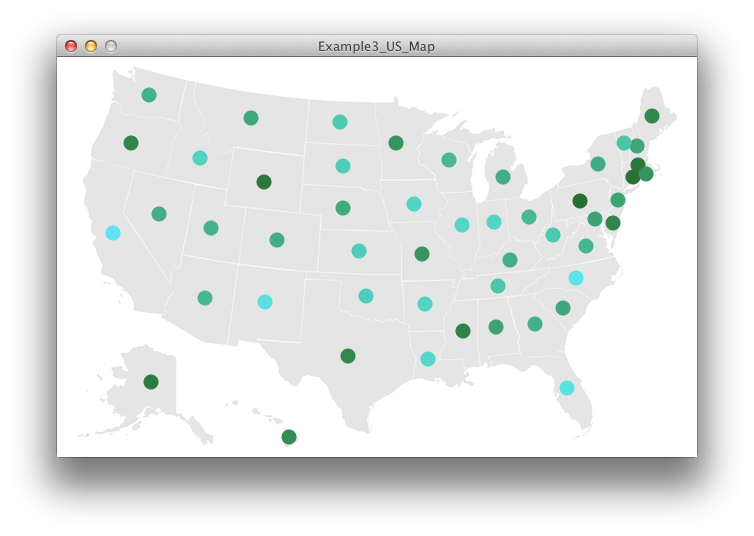

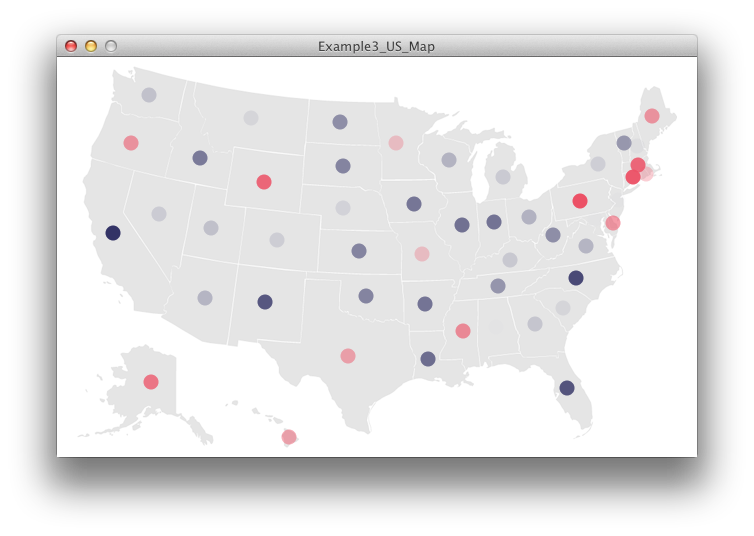
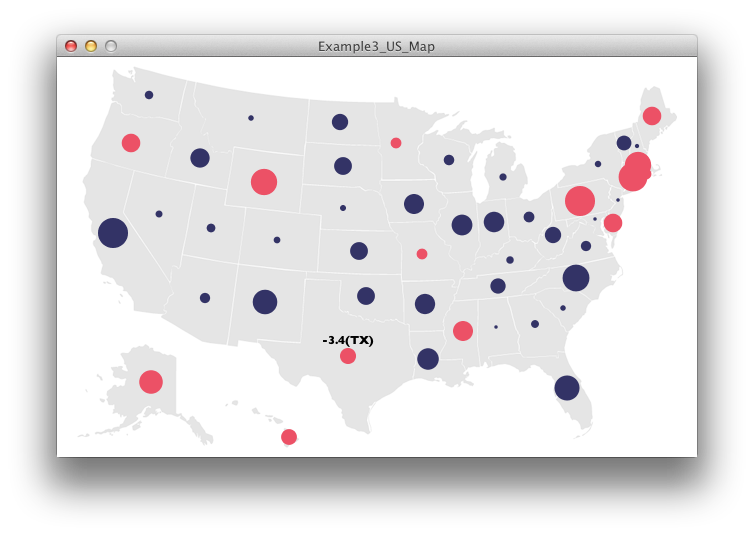
When I last posted on my work with Ben Fry's excellent book Visualizing Data, I posted all of two drawings, both of which were made with straight lines. Well, Chapter 3, "Mapping," does a heck of a lot more than that. It took me two days to get through this chapter (as opposed to 1:48 — I timed it — for Chapter 2). It was working on an interactive map of the US. Anyhow, the gallery above contains the many version of the sketches I did while following along with the examples. The still photos do not demonstrate the interactive, changing nature of several of these sketches, I've embedded a YouTube video below:
[youtube=http://www.youtube.com/watch?v=_Bm6nhZYW1o]
In the meantime, I think I need to go back to Daniel Shiffman's fabulous book Learning Processing to get up to speed on some of the intermediate stuff first.
Completed:
- Visualizing Data, Ch. 3: Mapping (17 exercises)